“True” spread of Coronavirus
by lars on 18/03/2020I’ve been wondering about the spread of the coronavirus. We can only test so many, and we can’t test fast enough.
That led me to think. The mortality rate of the coronavirus can only be estimated, and has indeed been estimated from 0.25% all the way to crazy 20% (which I don’t believe). The latest numbers I’ve seen that make sense is the CDC estimating 0.9% mortality rate.
The average incubation time of the virus seems to be 10 days. For the fatal cases, people seem to succumb to the virus and die on average 10 days after symptoms show. This means that there is a 20 day delay. From that we can calculate the likely number of infected up to 20 days ago. For example: If the mortality rate was 1% and 1 person died, that must mean that approximately 20 days ago 100 people were infected.
Disclaimer! I am not a medical professional or statistician or anything like that. I was just interested in the numbers. The numbers are purely based on actual reported deaths and the information that I have gathered. I might even have made mistakes in my calculations, so please correct me, if that is the case.
Here is a graph showing estimated spread in South Korea from January 26th up until February 26th based on an estimated mortality rate of 0.9%
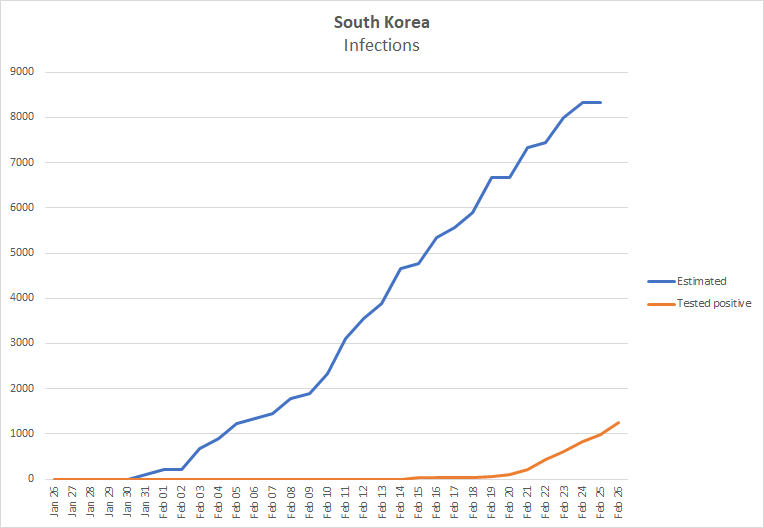
Note how few was actually tested positive vs. the estimated number of infected. Total estimated infected as of Feb. 26th: 9,000
Here is Italy:
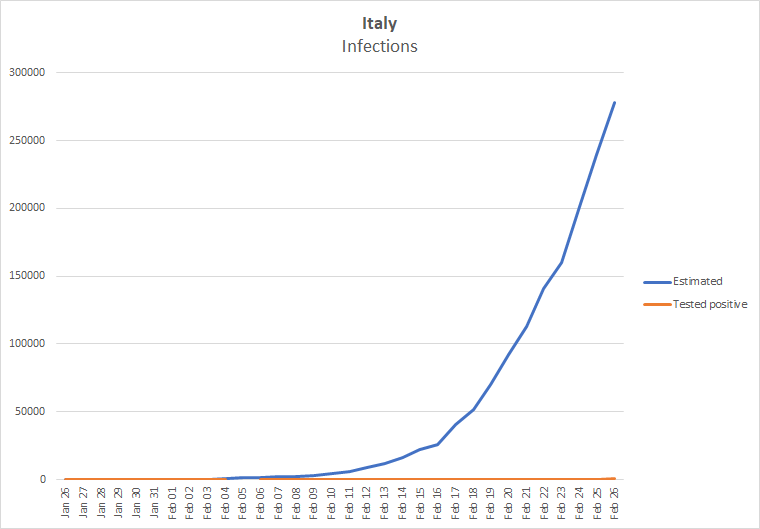
Note how few were tested vs. estimated infected. Number of positive tests hardly registers on the graph. Total estimated infected as of Feb. 26th: 278,111
Here is the USA:
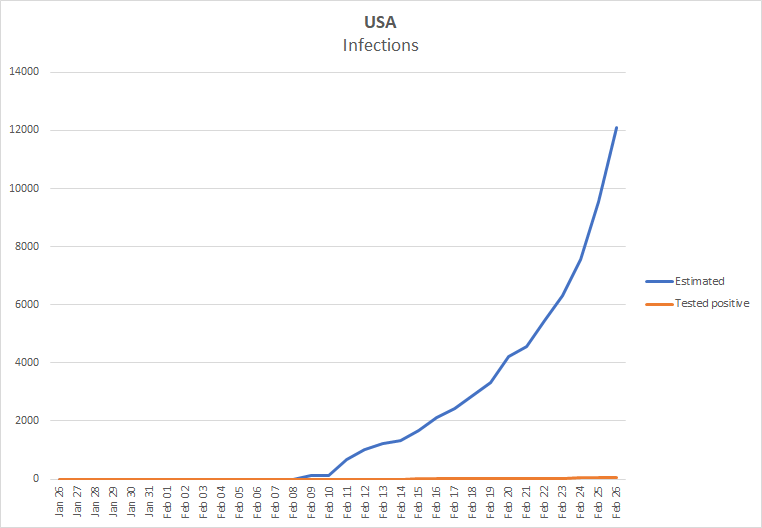
Again, the tested hardly registers on the graph. Total estimated infected as of Feb. 26th: 12,111
Based on a 0.9% mortality rate, the current number of dead – 8,790 would mean that 20 days ago around 976,667 people were infected.
It looks scary. Now if the fatality rate is high, that means there is less infected, but the number cannot be too high, since that would mean number of positive tests exceeds the number of infections. Here is the South Korea graph with a mortality rate of 6.4%:
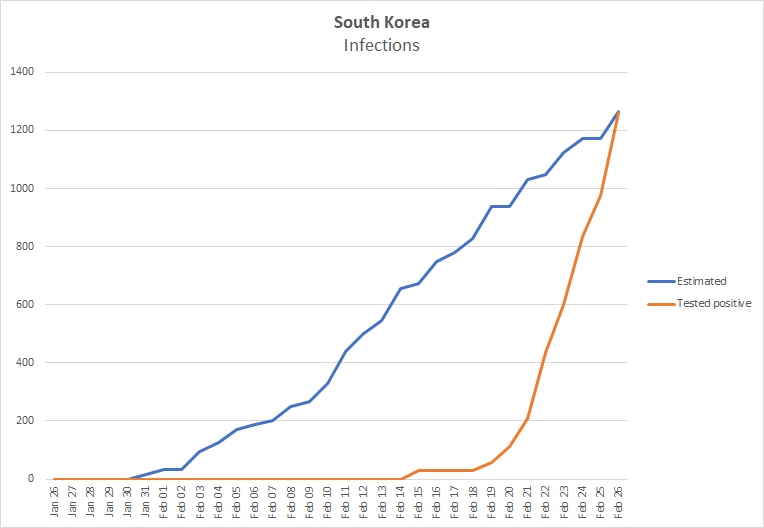
To me this means that the actual mortality rate must be a good deal lower than 6.4%.
As I said. This was for my own morbid curiosity (excuse the pun). Take it as you will.
Also, bear in mind that this is a look, at most, 20 days into the past.
Stay safe, people!
Oh, and if you are in need of hand sanitizer/disinfectant, e-liquid-recipes.com has a page that will help you follow the WHO-recipe for hand sanitizer :)